Lorsque vous savez exactement où partent vos dépenses et que vous connaissez l’empreinte carbone de vos déploiements, alors vous pouvez entreprendre de les réduire.
FINOPS & GREENOPS
Cycloid pour les gestions FinOps et GreenOps
Prenez les commandes de votre utilisation du cloud grâce au module Cycloid FinOps + GreenOps, qui comprend les coûts, l’empreinte carbone cloud, et les ressources.
Hi. In this video, we're going to review the FinOps and GreenOps modules in Cycloid. You have two aspects for FinOps and GreenOps in Cycloid. You have an estimation of the cost of the infrastructure before deployment, just to make sure before you deploy something, you are not going to get surprised with the price. And we have another module to do cost analysis VMWare we are going to import the data from the different cloud providers and generate some reports. So let's get started. The first thing I want to show you is the cost estimation. So let's take, for example, this deployment here. Here we have the configuration, which is the stack form that the user has deployed. And here you can see, for example, we have, RDS Postgres. We have some Elasticsearch that's, the end user configure. So if you want to change, for example, the instance class, you can do so by changing here. If I want to estimate the cost of these deployments before we actually change or deploy anything, then I can push this button and then it is actually analyzing the Terraform code that is behind. And here the whole platform is going to cost three thirty USD per month. And here, if I push this button, you can see all the details of everything that is going to be deployed. So you can see we have S3 bucket. We have some EC2 instance. We have some RDS here, some ALB and so on and so forth. The other aspect is the cost analysis. So if I move to FinOps and GreenOps, here you can see we have a dashboard with some reports. First of all, you need to connect an account from your different cloud providers. We support AWS, Azure, and GCP for that. So it's pretty simple. If I take, for example, GCP, you need a credential and then you need to access a project ID and then a billing dataset and then consequently a BigQuery, table that, will, hold the data, the billing data. It is exactly the same principle for, the other cloud providers. And then once you have done that and the import is complete, then you can go to dashboard. And here you can see actually the FinOps widget, which is multi cloud. So you can have the quota of consumption for the different cloud provider we have imported within, of course, this date range. And we have selected here a granularity of daily in that case. So this is the FinOps module. And then we have a global carbon footprint data module as well that is, showing you the global trend. And that shows not only the carbon footprint in pink but also the energy consumption. So you can see, how the shapes behave, regarding this carbon emission and energy consumption. Then you have a provider break breakdown. And here you have, we have three cloud providers, AWS, GCP, and Azure. And then we have a breakdown per project. And this is actually very interesting because it uses the tag on the cloud resources directly. So it is actually summing up including the carbon footprint, energy consumption, and the cost. It is, summing up all the resources having project equals Cycloid SaaS in this case here as a tag attached to the resources summed up in these numbers here. So if I click on this one, we have, here some, graph and we can actually group this data according to, for example, the category. Okay. And category can be networking, compute, database, security. And then I have an idea of, how the cost is spread among this category on a daily basis here. And, this is, filtered always for my cycloid SaaS deployment project. And I can subgroup as well, For example, per service, let's say. Okay. And then if I go down in this table here, here I can see that, I am in the finance aspect. I can change the currency eventually. Here the currency is euro. I can change to USD or different currencies. And then here I have the categories, but I remember I have also subgroup, per, per service. So for example, if I do security, I can see in security, I have the AWS WAF, and I have also the KMS. And this is the cost associated to this particular project in this date range and with a granularity of daily, and this is the number are in euro. Okay. So you can change, whatever you you want here. You can even filter addition additional dimensions. So for example here, it's only in this region. But if I have several regions, I could filter per region, or even with additional tags if I want to. And the very interesting thing in Cycloid is that this calculation is actually also made exactly in the same way to calculate the carbon emission. So it's one click away, actually. Exactly the same grouping, exactly the same filtering is applied. And here, I can see my c o two equivalent, my carbon emission for my project. And in exactly in the same way, I can see the energy consumption for my, different categories. So here is the FineOps and GreenOps modules that Cycloid can propose. I hope you like this video and I see you in the next one.
Quels sont les défis ?
DevOps values still aren’t the default values of your org
You don’t see any tangible business value yet
Hiring more engineers isn’t solving your problems
Le temps presse… et l’argent s’envole
Aucune entreprise ne peut se permettre d’ignorer les coûts et le gaspillage sur le cloud ; et soyons francs, tout cela aura été une histoire assez chaotique jusqu’à maintenant. Les données sur les dépenses cloud sont réparties sur les interfaces des différents fournisseurs, donc toutes les voir de manière centralisée est presque impossible. Accéder à votre empreinte carbone cloud est encore plus difficile – au mieux vous ne pouvez obtenir que des estimations, et au pire des données incorrectes ou qui arrivent trop tard. C’est pourquoi nous avons ajouté nos solutions FinOps et GreenOps au sein de notre plateforme.
Si vous souhaitez prendre le contrôle de votre utilisation cloud et réduire le gaspillage ainsi que votre empreinte carbone, vous serez ravis d’entendre que Cycloid vous réserve un autre bienfait.
Les coûts du cloud ne devraient être livrés au hasard sous aucun prétexte
Pourquoi Cycloid ?
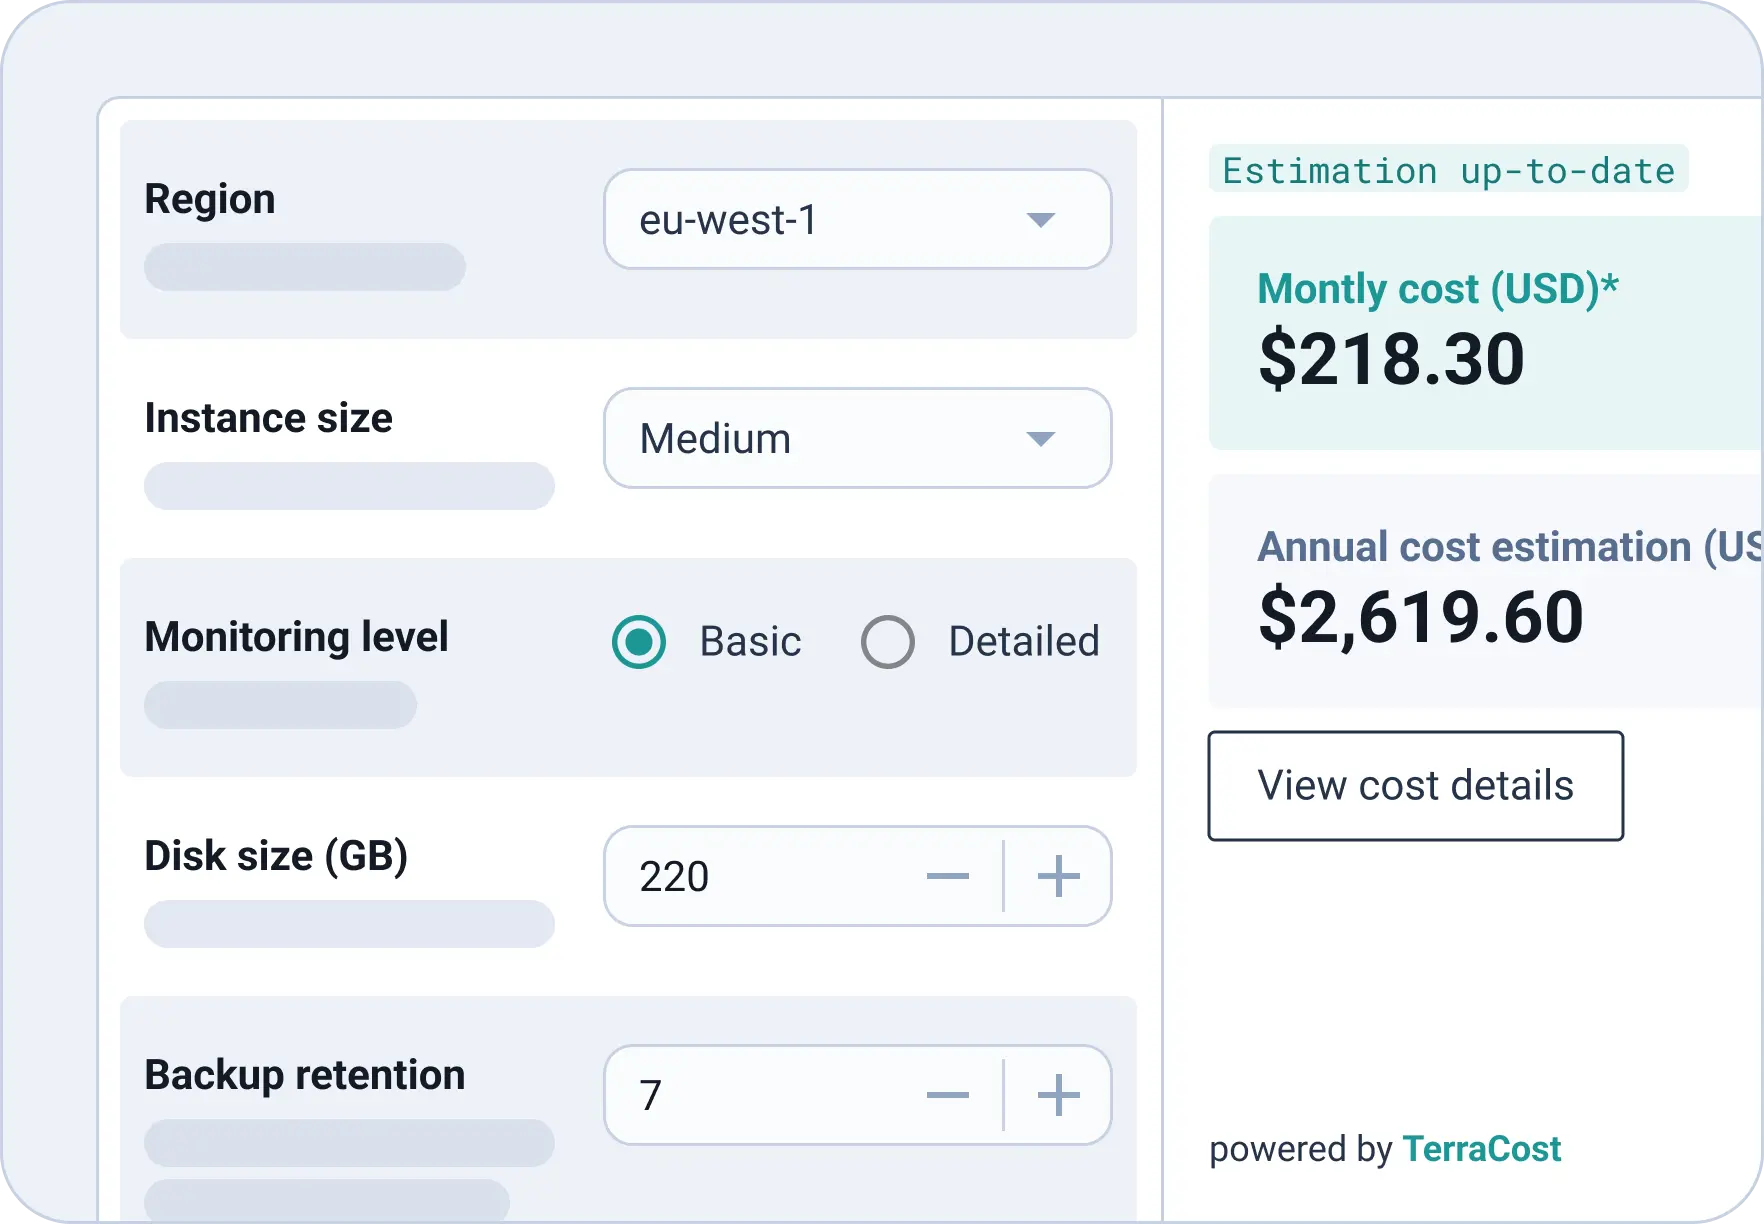
Une prévision des coûts entièrement intégrée
N’aimeriez-vous pas savoir combien vous allez dépenser avant le déploiement ? L’Estimation des coûts cloud de Cycloid, qui s’appuie sur notre fonctionnalité FinOps open-source TerraCost, calcule le prix d’une infrastructure selon le Terraform associé et fait partie autant de Pipelines que de StackForms. Évitez les mauvaises surprises en permettant aux utilisateurs finaux de connaître le coût de leur déploiement avant qu’il ne soit effectif, et en promouvant une culture de responsabilité commerciale partagée chez vos équipes.
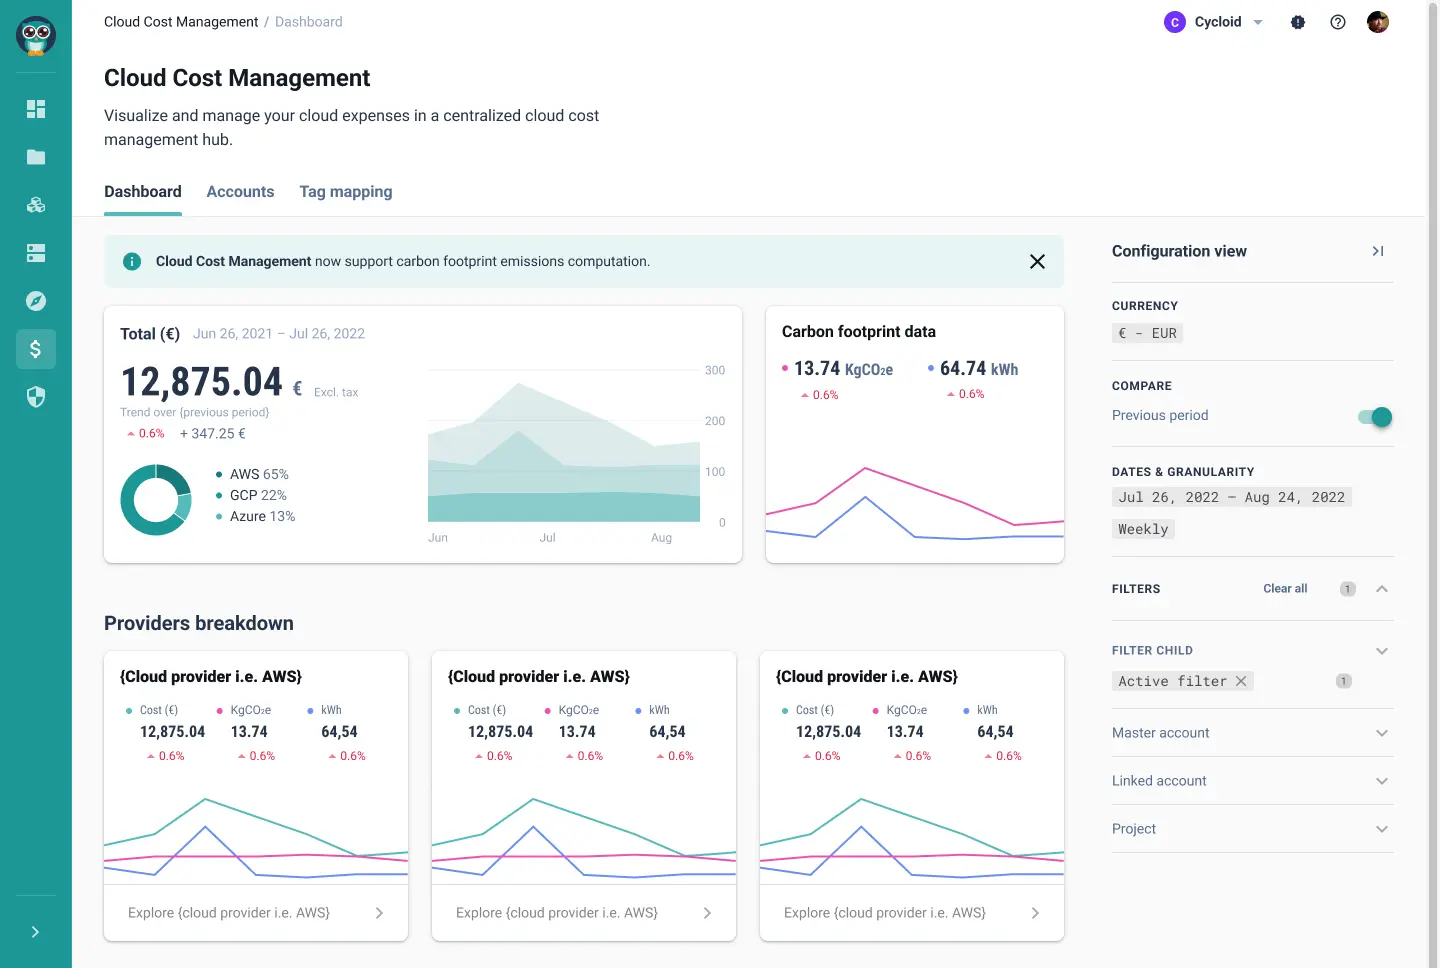
Une vraie visibilité des coûts
Centralisez et surveillez toutes vos dépenses cloud depuis un seul emplacement. Notre module intégré de Gestion des coûts du cloud vous offre une représentation graphique avec un affichage individualisé qui peut être filtré selon le projet, le fournisseur (AWS, Microsoft Azure, Google Cloud Platform), l’étiquette, la région, et la date, entre autres.
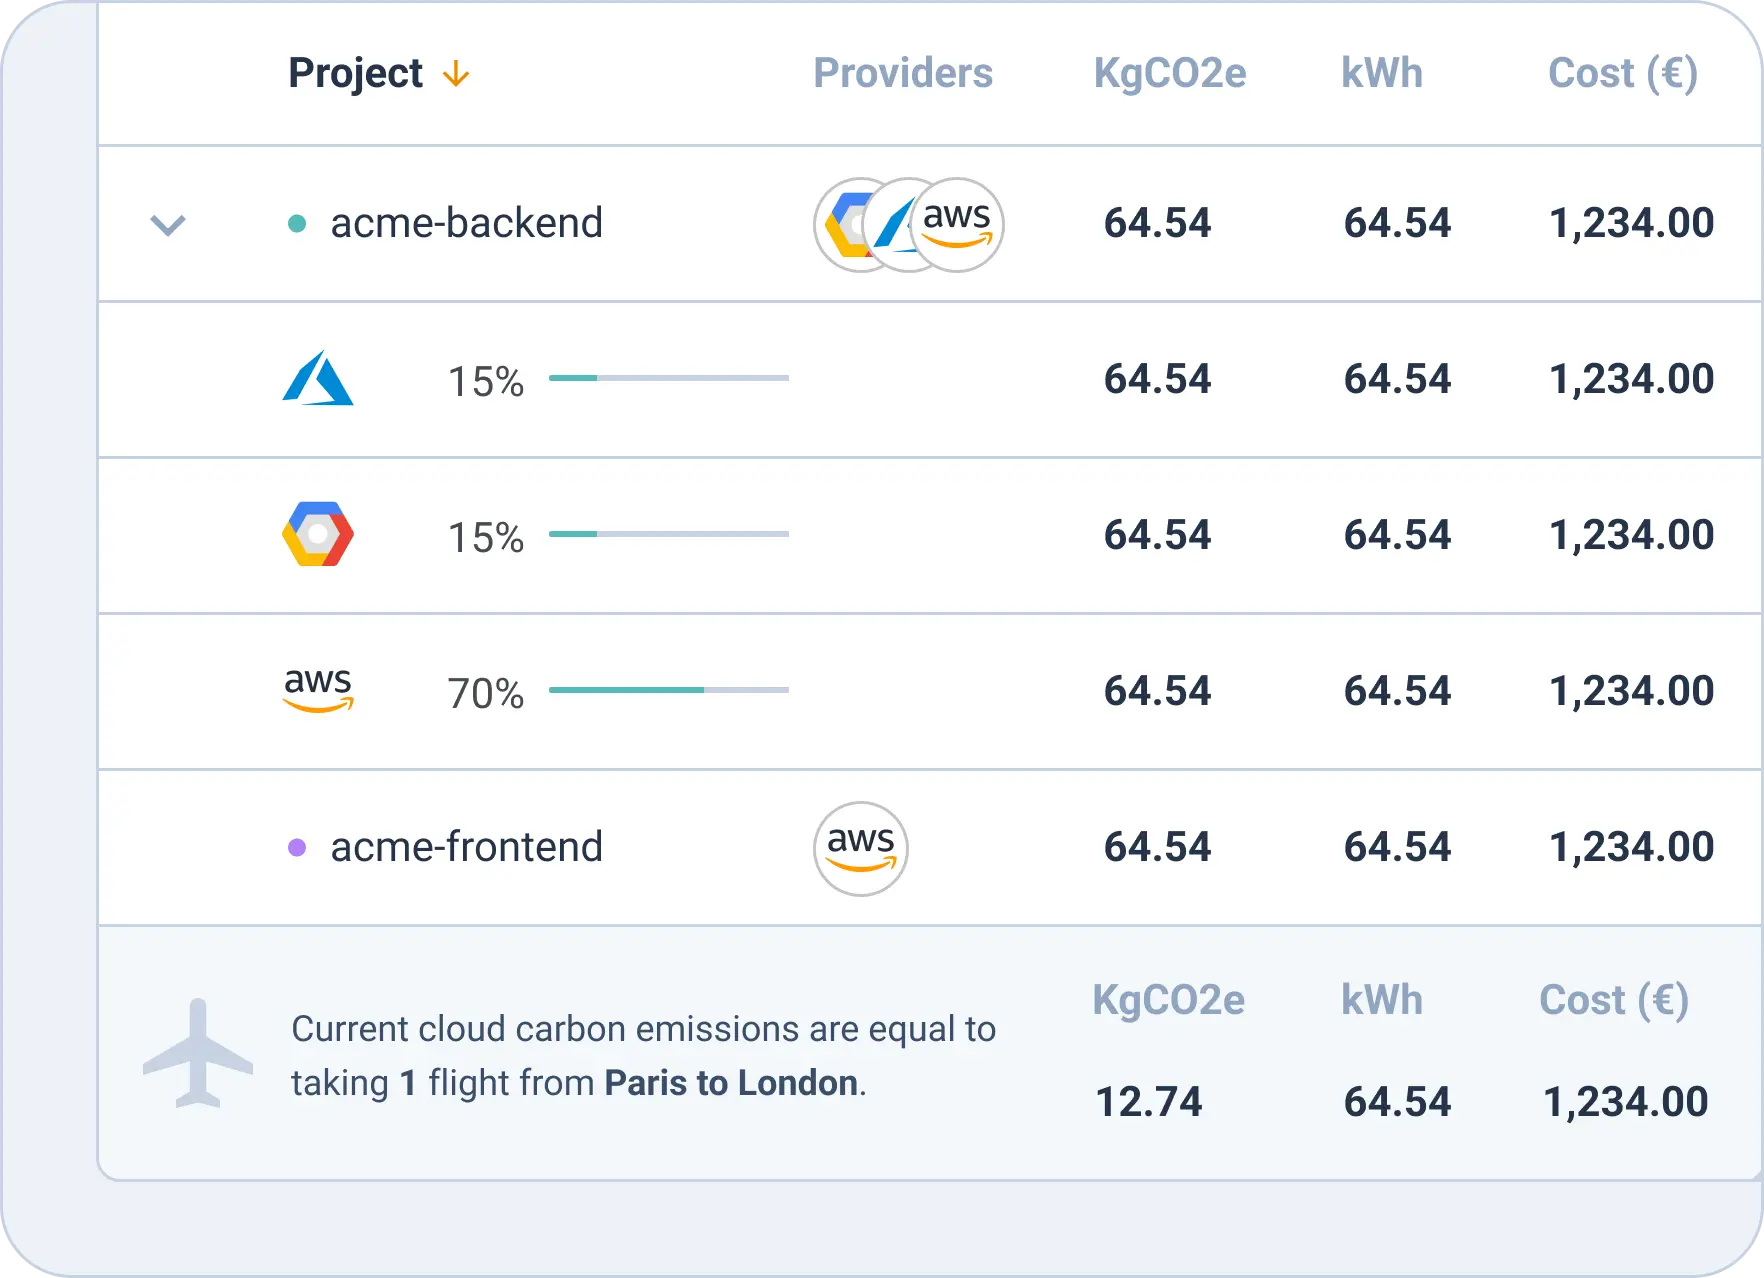
Réduisez le gaspillage cloud
Une entreprise gaspille en moyenne 40% de ses ressources cloud (pour lesquelles elle a payé et signé un contrat) … Cela représente non seulement un non-sens financier mais aussi un danger pour l’environnement. Notre module FinOps est accompagné de la fonctionnalité Cloud Carbon Footprint qui vous permet d’observer de plus près vos émissions carbone sur le cloud et de prendre des décisions plus sages et plus écoresponsables à l’égard de votre consommation cloud.
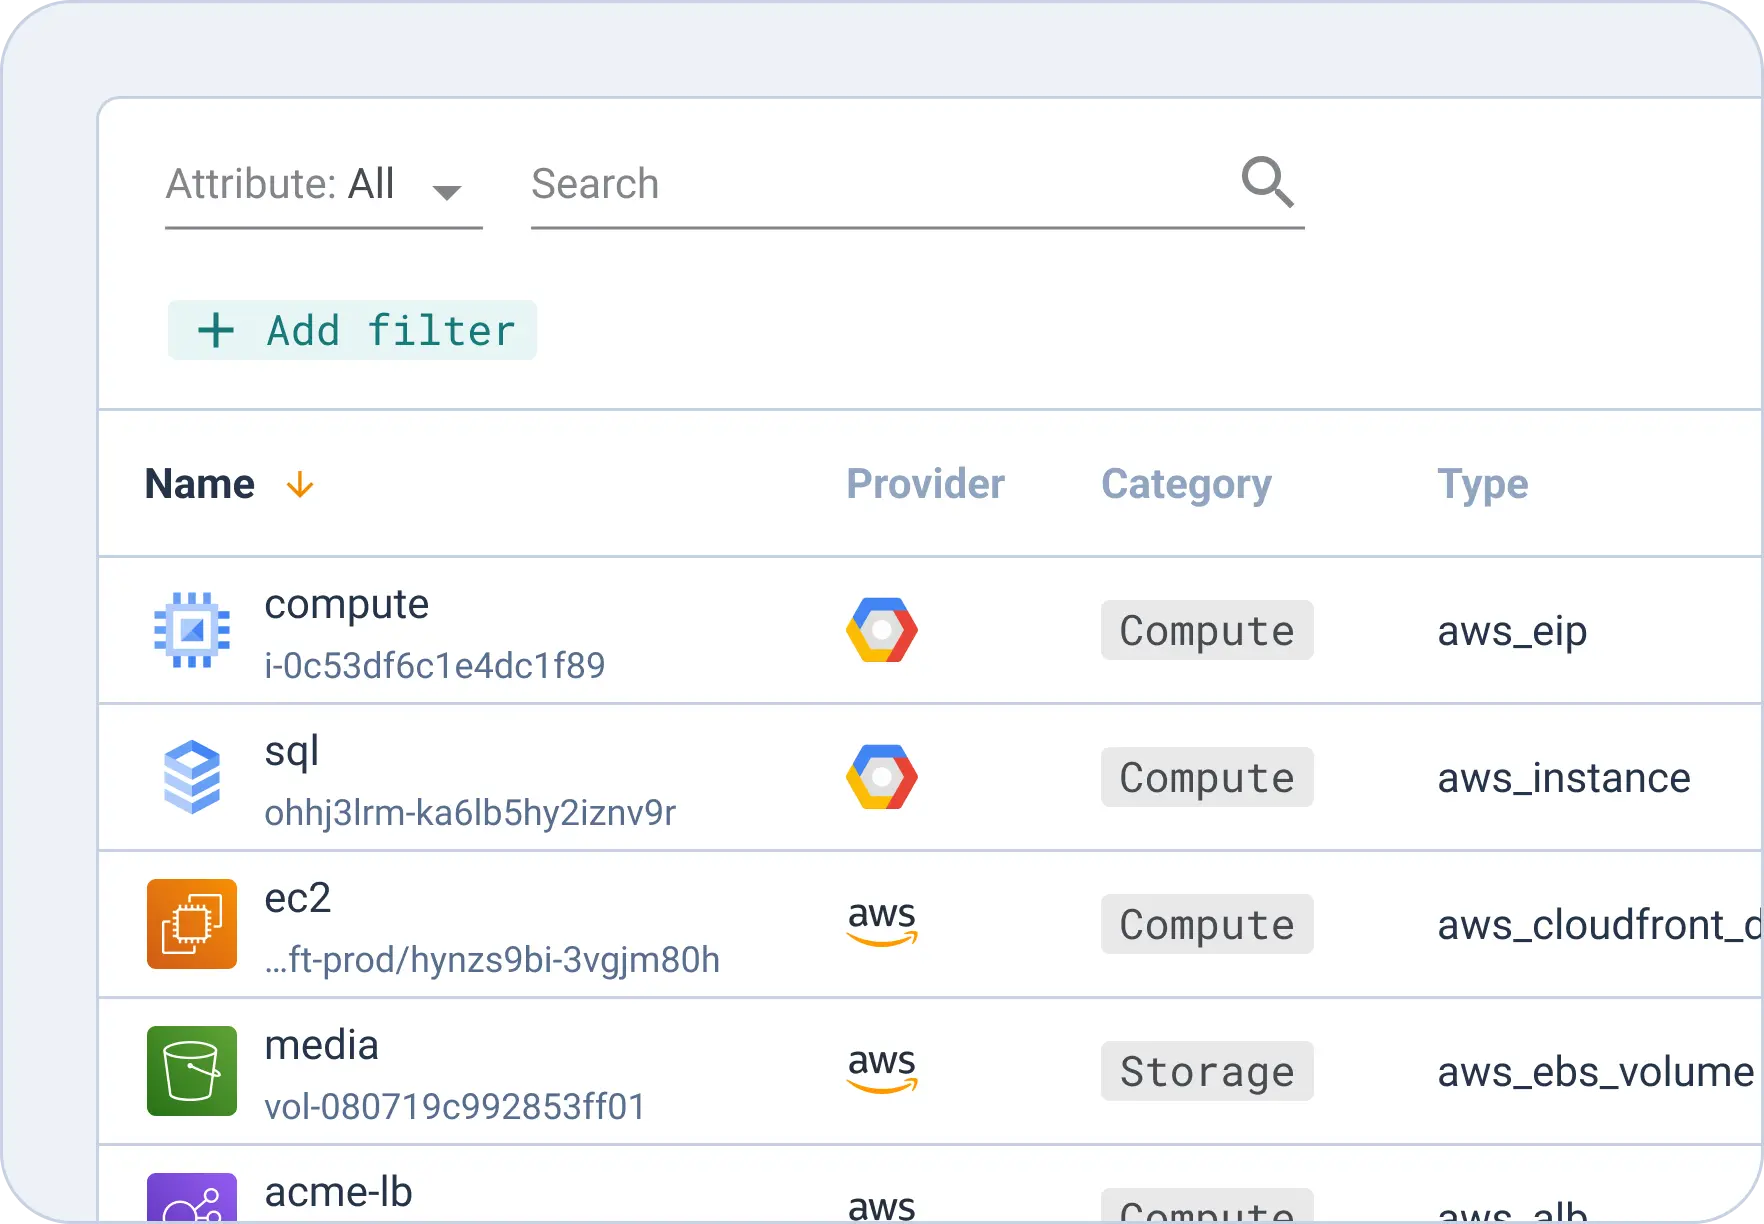
Une gestion des ressources simplifiée
Ne perdez plus un seul gigabyte ! Notre module Inventaire des ressources sert à voir toutes les ressources publiques et privées d’un coup, ainsi vous pouvez savoir combien d’entre elles ont été mobilisées par projet, par équipe ou par fournisseur, entre autres. La surconsommation des ressources de cloud privé vous inquiète ? Établissez des quotas de ressources dans l’outil Gestion des quotas et allouez des ressources de cloud privé (Nutanix, WMWare) selon les équipes.
Développez à la manière Cycloid
Une surveillance accrue
Mettez un terme au contrôle des coûts normatif et aux dépenses imprévues : si tout le monde est responsable de la gestion des coûts, le gaspillage n’aura pas droit de cité.
Une meilleure visibilité
La transparence et la collaboration conduisent à des meilleures décisions concernant le cloud ainsi qu’à une innovation plus stable.
Des coûts réduits
Ne laissez pas le FinOps être le maillon faible si vous souhaitez réussir : vous devez y remédier
Découvrez Cycloid dès maintenant
Vous souhaitez voir les solutions FinOps de Cycloid à l’œuvre ?
